Knowledge Discovery in Databases Project
This project is about the Knowledge Discovery in Databases (KDD), a field of computer science that has the goal of extracting interesting and unknown information from raw data. I will illustrate the 7 phases which are required to realize this process. Data are about an Intrusion Detection System.
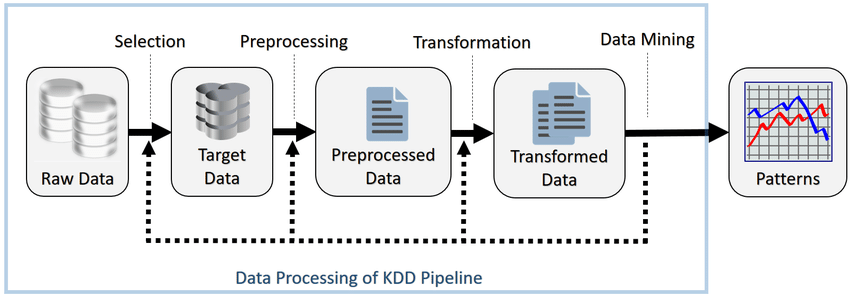
The 7 phases are:
- Understand the application domain, the desired results and the certainty level.
- Select the data and identify the representation. The attribute reading can be fulfilled in the static way (analyzing the code), in the dynamic way (running the code) or a mix.
- Preprocessing: the attributes are analyzed to verify if the values are wrong or missing. Usual tools for displaying data are used.
- Data transformation: data are transformed to be accepted by the data mining algorithm.
- Choice of the task and the Data Mining algorithm: this phase is done following the requested output typology, its quality in the context and the input data format. If data aren’t in the accepted format, they must be transformed again.
- Identify the value of algorithm parameters that give the desired result.
- Validate the pattern with other data. In case of negative results, it is necessary to come back with a quantity which depends on the error.
About the project, the 7 phases consist of:
- The application domain has been understood to be an Intrusion Detection System (IDS). It has been realized in the Canadian Institute for Cybersecurity (CIC), that it is part of the University of New Brunswick. The project of this dataset is called Intrusion Detection Evaluation Dataset (CIC-IDS2017). The traffic generation was from a complete infrastructure composed of modem, firewall, switch, router and computer, the latters having Windows, Ubuntu or Mac OS X as operating system. The dataset contains the statistics of connections captured from the IDS and classification as malicious or benevolent. The statistics generation has been by means of the tool CICFlowMeter, its description can be found in this page.
- A subset of the data was selected with 10000 examples for the train phase and 2000 for the test phases. A binary attribute was utilized to classificate data, which value 1 identifies the normal traffic and the value 0 identifies the attack traffic.
- Through the functions available from Pandas library (it has been utilized for the dataset load) and Scikit-learn library, it has been possible to realize the scatter and box plot and then calculate the Mutual Information.
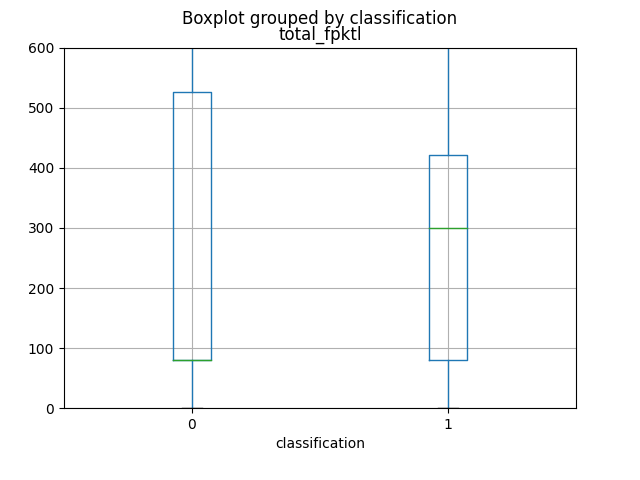
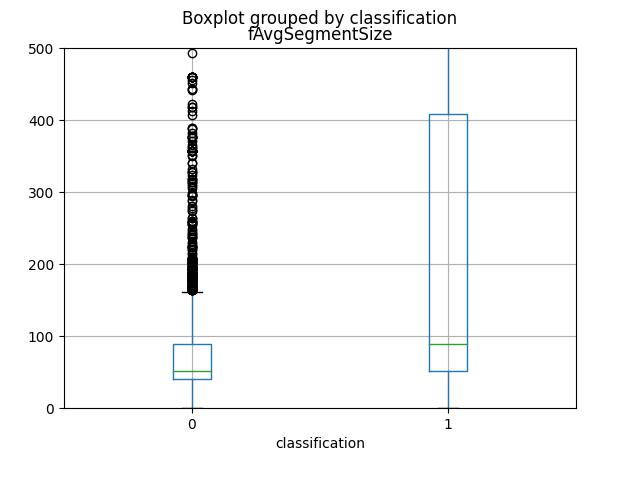
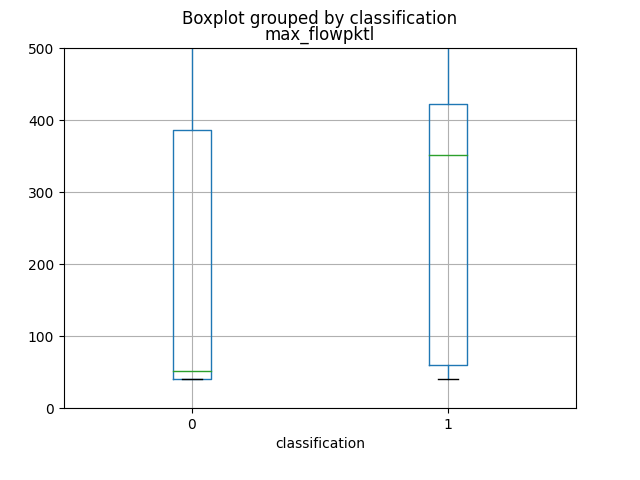
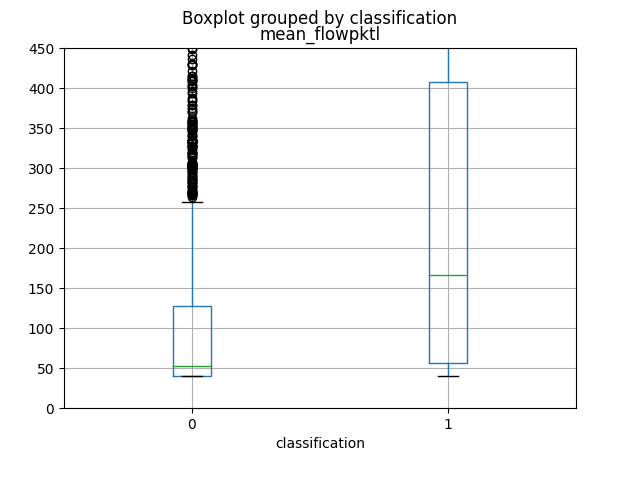
The first 4 attributes, which produce more informations, as you can view from graphics and from the Mutual Information calculation, are named respectively as total_fpktl, fAvgSegmentSize, max_flowpktl e mean_flowpktl.
- Given that the dataset has already been in a compatible format with the machine learning algorithm, it hasn’t been necessary to transform the data.
- Through a 5-fold Cross Validation, the best parameters configuration has been identified for two Random Forests, one built on whole train set and the other built on the 10 best principal components. The parameters with respective values that have been tested are:
- max_features: it indicates the maximum number of attributes to utilize. The possible values are
sqrtandlog2, which are functions applied to a number of attributes. - n_estimators: it’s the number of trees in the forest. The possible choice of values is among
10,20and30. - max_samples: it specifies the data fraction which is utilized to build the single tree. The tested values are:
0.5,0.6,0.7,0.8e0.9.
- max_features: it indicates the maximum number of attributes to utilize. The possible values are
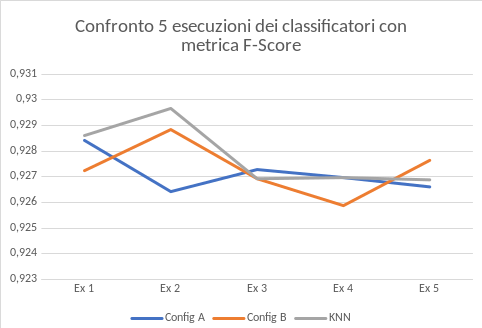
- The F-score metric has been utilized to choose the best configuration of the two Random Forests and it is based on the Precision and the Recall measures. So the configuration with the highest value has been chosen. After this individuation, two operations follow: the first to retrain the two Random Forests on the whole train set, the second to build a third classifier. This third classifier is a KNN that uses the two previous Random Forests.
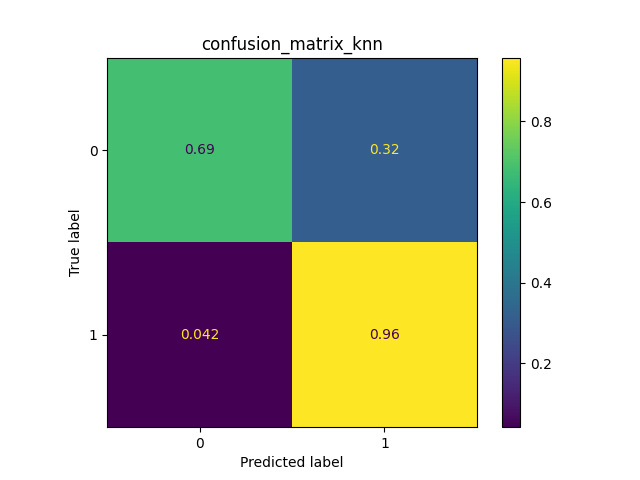
- This last phase is dedicated to evaluate the three classifiers through the test set. A confusion matrix and a graph of the F-score metric are used. The last one shows the result of 5 executions. As you can see, the classifier with best results is the KNN. This classifier, that joins the two Random Forests, allows each one of them to get better.


Project link: https://github.com/Tecnomiky/data_analysis_for_security